The data you already have can transform your marketing
How many times have you thought that data-driven marketing is something for big companies, with huge budgets and dedicated teams? It is simply untrue. The truth is that almost all companies – even the smallest ones – already have an invaluable resource: their Primary Data.
Think about it: every invoice, every CRM entry, every booking list or sales history is a mine of information. However, this data often remains there, unused and wasted, like a treasure trove hidden under a heap of operational activities that make us forget that sometimes it is worth taking a break from manual activity to understand how to work better.
This is where the Marketing Information System (MIS) comes in, a tool that can help you collect, organise and use this data to improve your strategy. It is not rocket science: it is a combination of processes and tools that any company can adopt to turn numbers and records into practical insights.
In this article, I would like to show you how MIS and a research plan based on your Primary Data can become a decision-making tool for you that will surely bring you many benefits, such as better customer insight, more personalised offers and very high customer satisfaction.
What is a Marketing Information System (MIS)?
To understand what a Marketing Information System (MIS) is, think of it as the command centre of your marketing. It is a structured system for collecting, analysing and distributing useful information to make smarter, more targeted decisions.
But mind you, we are not talking about something purely technological: an MIS is made up of processes, people and data.
How does an MIS work?
A Marketing Information System aims to bring order to the chaos of data that often remains scattered between invoices, CRM, social media, website statistics, management sales records of all kinds and booking lists. His task is to transform this information into practical insights that enable:
- Better understand customer behaviour.
- Identify growth opportunities.
- Create marketing strategies based on hard data, not hunches.
Data sources for your MIS
The sources for an MIS can be many, but the most common include:
- Internal Data: Sales logs, transaction histories, data from the CRM and management systems that you use every day at work, excel that you may have haphazardly on your computer, information that comes to you from insights from company social accounts and those found in the analytics system that is installed on your website and even booking lists. These represent so-called Primary Data, an often overlooked resource.
- External Data: Market trends, industry reports, demographic data, competitive analysis.
Why an MIS is affordable
You don’t need a multinational infrastructure to implement a Marketing Information System. The data is there. You just need to develop that ‘data culture’ that leads you to collect, sort, analyse and interpret the data at your disposal. The data is there. You just probably don’t look at it or don’t know how to put all the information you have in order.
Even with simple tools and well-defined processes, you can begin to make use of the data you already have. The important thing is to have a systematic approach: to know what data to collect, how to organise it and, above all, how to use it to make more informed decisions.
MIS is not just a technology, it is a way of thinking. And the beauty is that it can work for any company, regardless of size or budget.
Primary Data: the cupboard to be tidied up
Many companies think that doing ‘data-driven marketing’ (or, more simply, data-driven promotion and communication activities) requires huge investments in software or consultancy. In reality, most companies already have access to a great deal of information.
This information consists of data collected directly by the company during its daily operations, an often neglected resource just waiting to be exploited.
Where to find Primary Data in your company
This data can come from different areas of the company’s business, both offline and online. Here are some of the main sources:
- Sales records: How often do your customers buy? Which products are the most sold?
- Invoices: What is the average value of each order? Are there recurring customers or high-value orders?
- CRM: Which customers are the most active? What is their behaviour over time?
- Reservation lists: When do customers prefer your services? Are there seasonal peaks?
- Website statistics: How much traffic comes to your site? Where do visitors come from? Which pages do they visit most often?
- Browsing data: How much time do users spend on the site? Where do they click? When do they abandon the shopping cart?
- Social media statistics: Which posts get the most engagement? Which content attracts your audience?
- Customer support: Customer calls and emails contain valuable requests, doubts and suggestions. What do customers ask for? What issues often come up?
- Reviews and feedback: Online reviews and surveys can reveal what customers value or would like to improve.
- Business management software: Software used in operational departments collects useful data to improve efficiency and identify opportunities.
- Unstructured Excel files: Even informally collected data, if organised, can provide strategic insights.
The value of a customer: Lifetime Value and Customer Equity
Not all customers have the same value for the company. This is the time to introduce two fundamental concepts: Customer Lifetime Value (CLV) and Customer Equity.
Customer Lifetime Value (CLV): This indicator measures the total value that a customer generates for the company over the course of their relationship. To calculate it, it considers:
- The frequency of purchases.
- The average value of each order.
- The estimated duration of the relationship.
If you know the CLV of your customers, you can segment them and focus on those that offer the most potential. Ask yourself:
- Is there anything more I can do for them?
- Are there customised offers to upsell again?
- Can I implement upsell or cross-sell strategies?
For example, if a customer regularly buys a product, you could offer them a subscription or a complementary product that improves their experience.
Customer Equity: This represents the overall value of all your current and future customers. The more you increase the CLV of individual customers, the more your company’s Customer Equity grows. Investing in customer loyalty and improving the customer experience is a direct way to reinforce this value.
Qualitative or quantitative? Two ways of reading data
When analysing your Primary Data, it is important to ask yourself: what kind of information do we want to obtain? what kind of investigation do we want to develop? You must therefore distinguish between qualitative and quantitative analyses, two approaches that answer different questions.
- Qualitative analyses: they help you understand what your customers want and why they want it. This information emerges from reviews, feedback and interactions with customer support.
- Quantitative analyses: They measure how much your customers are worth in numerical terms, such as the CLV or conversion rate of your offers.
How to develop an effective Marketing Research Plan
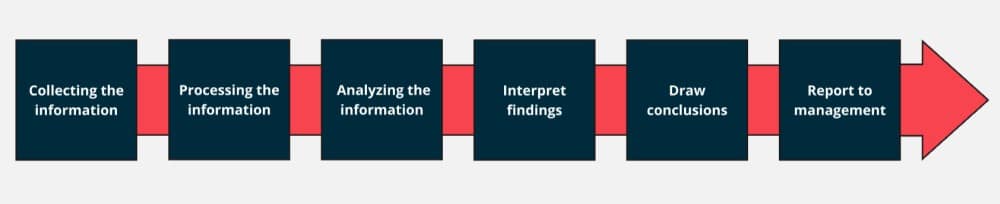
A Marketing Research Plan is a guide that enables you to turn data into strategic decisions. By following a well-defined process, such as the one shown in the image, you can collect, analyse and interpret information to gain practical insights and improve your marketing strategy. Let’s look at the basic steps together.
1. Gather information
The first step in developing an effective research plan is to collect useful data from your company’s various activities. No matter if you run service delivery, supply subscriptions or use a platform, sell physical objects or book hotels and holiday homes: there are metrics that can ALWAYS give you information about your customers and your market. Let’s look at some of the main sources and how these can be used:
Bookings
- Occupancy Rate: Indicates how much of your capacity (e.g. rooms, appointments or slots) is actually booked. It helps you understand whether you are making the best use of your available resources.
- Average Booking Value: This is the average economic value of each booking. This figure allows you to identify which types of services or packages generate the most profit.
- Average Lead Time: This is the average time between booking and when the service is provided. It serves to better plan resources and anticipate possible peaks in activity.
Subscriptions and Subscriptions:
- Renewal Rate: Shows how many customers decide to renew their subscription. If it is low, it could be a sign that the offer is not attractive enough or that there are problems with the service.
- Average Subscription Lifetime: Tells you how long, on average, customers keep a subscription. A high value indicates good retention.
- Cancellation Rate (Churn Rate): Measures how many customers cancel their subscription. Analysing this helps you understand if there are specific problems that lead customers to leave.
Customer support:
- Number of monthly requests: How many calls, emails or messages do you receive in a month? This metric helps you understand how much customers need support and whether there are recurring problems.
- Average Response Time: Indicates how long it takes your team to respond to customers. Long response times can generate dissatisfaction.
- First Contact Resolution Rate: Shows how many requests are resolved at the first interaction. A high rate indicates efficient service.
Website and online platform statistics:
- Conversion Rate: Represents the percentage of visitors who complete an important action, such as a booking or subscription. It helps you understand how effective your site or platform is at turning visitors into customers.
- Drop-off Rate: Indicates how many people leave the process (e.g. booking or purchase) before completing it. It signals where your system could be improved.
- Recurring Traffic Rate: Shows how many visitors return to your platform. A high value indicates good engagement with your audience.
Feedback and reviews:
- Distribution of ratings: Collect data on positive, neutral and negative reviews. They allow you to identify strengths and areas for improvement.
- Net Promoter Score (NPS): A simple question: ‘How likely are you to recommend our service/product?’ This score tells you how satisfied and loyal customers are.
- Recurring themes: Analyses feedback to understand which problems or requests come up most often. This gives you a clear idea of what really matters to your customers.
2. Process the information
Once collected, the data must be organised and structured clearly. At this stage:
- Centralise the data: Put all information into one system or worksheet.
- Clean the data: Remove duplicate, obsolete or incorrect information.
- Classify information: Group data by useful categories, such as customers, products or behaviour.
3. Analyses information
Analysis is the real heart of the process. It is the stage where you turn raw data into useful suggestions and information:
- Find patterns and trends: Examine customer behaviour to identify recurring opportunities, behaviours or problems.
- Segment customers: Break them down into homogeneous groups, such as new customers, loyal customers or at-risk customers. Or segment them by geography, demographics, purchasing trends… depending on the type of information you want to extract.
- Measure value: Calculate Customer Lifetime Value (CLV) to understand how much a customer contributes to your business over time.
4. Interpret the results
Interpretation is where the numbers become useful. It is here that you analyse what the data means for your business, identifying problems, opportunities and practical solutions. This step is crucial because it is not enough to collect information: you need to understand it and use it to improve your decisions and strategies.
How to interpret the results?
Interpreting data is like having a jigsaw puzzle: each piece is information that, when put in the right place, allows you to see the complete picture. It is not enough to just pick up the pieces: you have to understand how they fit together to solve problems and seize opportunities. You have to look at that data and ask yourself:
- What does this data mean? What patterns emerge?
- What are the main problems (pain points)? Where do you lose customers or opportunities?
- What are the benefits I can obtain (gains)? How can I turn this information into benefits for the company?
Examples of solvable problems (pain points):
Dissatisfied customers: If feedback shows recurring complaints about a specific aspect (e.g. customer support response time or difficulties in navigating the site), this is your wake-up call. For example: ‘25% of reviews mention slow delivery.’ → Solution: Review logistics processes.
High abandonment rate: Example: Website data shows a 50% cart abandonment rate. You are losing potential sales. → Solution: Improve the user experience, offer easier payment options or implement retargeting strategies.
Low renewals: Subscription renewal rate below 30%. Customers do not find sufficient value in your service or perhaps your competitors offer more. → Solution: Introduce exclusive subscriber benefits or renewal incentives.
Examples of exploitable opportunities (gains):
Precise customer segmentation: If you notice that 40 per cent of your sales come from a specific segment (e.g. customers over 50 buying in physical shops), you can create customised offers for this category.
Upsell and cross-sell: Data may show you that customers who buy a specific product are more likely to buy a complementary product. → Solution: Offer targeted bundles or suggestions.
Seasonal promotions: If your bookings increase during a certain season, you can anticipate peaks in activity and launch targeted promotions in advance.
Why does interpreting results make a difference?
- Make decisions based on data: Stop making ‘gut’ choices and start relying on concrete numbers.
- Optimise resources: With the right data, you can understand where to focus your efforts for maximum performance, avoiding waste.
- Increase customer satisfaction: If you solve their problems and anticipate their needs, you build trust and loyalty.
- Maximise customer value: Through targeted actions such as upsells, cross-sells or customised campaigns, you can increase Customer Lifetime Value (CLV).
5. Draw conclusions
Now that you have your data and have analysed it, it is time to put your conclusions on paper. This step is crucial: it is not enough to know what is wrong or where you can improve, you have to translate everything into concrete and useful actions for your business.
How to draw useful conclusions?
Focus on what matters most: not everything needs immediate attention. Ask yourself: What is the most important thing I can solve or improve right away?
Turn findings into practical actions: each discovery must lead to a concrete step. For example:
- Finding: Many customers abandon the booking process at checkout.
- Action: Simplify the checkout, add payment options or send automatic reminders to complete the booking.
Create a priority plan: you can’t do everything at once. Organise your actions according to what has the greatest impact and set realistic timeframes. It is important to create an agenda, a to-do list. Make sure that each of these activities has start and end dates and possibly also managers. Keep an eye on whether your action plan is adhered to.
6. Report to management
Finally, communicate the results to corporate decision-makers in a clear, concise and visual manner:
- Show the evidence
- Use graphs and tables to highlight key points.
- Recommend practical actions, explaining how your proposals can improve business results.
- Keep the focus: Do not overload the report with unnecessary detail.
The benefits of these analyses
One of the fundamental problems for many companies is that they do not really know their customers. Sure, things are going on: products are being sold, services are being provided, but a clear vision is often lacking. We don’t really know who our customers are, what makes them satisfied or dissatisfied, and what are the decisive levers that make them choose between us and our competitors.
We don’t know their customer journey, how they make decisions or what really makes them buy. It is like navigating without a compass, the boat is moving but we don’t really know where it is going: we make investments in marketing, we launch campaigns, but without a clear direction, we risk wasting time and money.
That’s where data analysis comes in. Using the information you already have, you can transform the way you market and solve these problems. Not only will you get to know your customers better, but you can finally build strategies based on hard data, not assumptions.
1. Know your customers and their needs better
Data analysis helps you understand who your customers are, what they want and how they interact with your company. For example, you don’t know why some customers come back often while others stop at the first purchase or booking. Or maybe you don’t know exactly what customers are looking for in your offers. What is your value proposition, and how does it meet/diverge with the needs/desires/problems of your audience?
2. Create personalised offers and communications
Customers today expect tailor-made treatment. Data analysis allows you to tailor offers and communication to the real needs of each customer segment: if you send the same offers to all your customers, you are probably getting mediocre results. With customised offers, you can increase conversions and improve your relationship with your customers, showing that you really know them. Not sure how to communicate effectively with different customers? Try segmenting your customers and send relevant messages to each group.
3. Improve customer satisfaction
A satisfied customer is a returning customer. Data analysis helps you identify problems and prevent them, improving service quality. Look at reviews, interview your customer service people, read the requests that come in most often. Make customers happy and you will see their lifetime value increase.
4. Increase profitability and efficiency
Data analysis is not only a tool to improve customer relations, but also to optimise economic results: identify which customers or products bring you the most profit. Study where to focus your efforts to maximise results. Optimise budgets by focusing on targeted strategies and more profitable customer segments.
Conclusion: after much talk…
Doing analysis is a process that grows step by step, almost without you realising it. Maybe you start with something simple, like figuring out which customers buy most often or which products go best. And from there, almost naturally, other questions pop up: why are these customers buying more? What could I do to win new ones? What is the correlation between the fact that they buy this product using the online channel and another product only from the offline channel?
If you are not an expert, it is normal not to know where to start or what questions to ask the data. But you don’t have to worry: just get started. The more you look at your numbers, the more curiosity arises, and the more you find answers that help you improve. It’s a virtuous cycle: analysis, discovery, new analysis.
You don’t need to start with complex analyses. Even the simplest things – like understanding who your best customers are or which days you sell the most – can bring you concrete results. And these are really within everyone’s reach! Why miss the opportunity to better understand your customers and grow your business?
Remember, marketing is not about luck, it’s about making informed choices. And data is your best ally in making decisions that really work. Get your numbers in order, start looking at what they tell, and you will see that marketing more effectively is possible. Just get started!