From theory to practice: The complete kit for monitoring and improving the customer experience
In previous articles Customer retention, Hold on to your customers! and Top 10 customer satisfaction trends in 2024, we have already talked about customer experience and how important it is to put it at the centre of your marketing. But what happens if we don’t measure it? We lose customers, upsell opportunities and have to spend more time and resources to acquire new leads. Today we will look at the essential metrics to avoid this.
According to an article published by Forbes, acquiring a new customer can cost up to five times more than retaining a current customer. Moreover, the return on investment of a customer retention strategy is significantly higher. A satisfied customer not only tends to return, but is also more likely to increase their spending and recommend the company to others. This virtuous cycle allows companies to optimise their resources and strengthen the relationship with their customer base.
Adopting an approach based on customer experience metrics is not just a good practice, it is an investment.
- For an entrepreneur, these metrics offer a clear vision of how to improve satisfaction, stimulate loyalty and maximise the value generated by each customer.
- For the company, the result is a virtuous cycle of reducing acquisition costs, increasing profitability and strengthening its competitive position.
We will now introduce the key customer experience metrics, showing how they can turn customer management into a strategic lever for business success:
- Net Promoter Score (NPS)
Measures the likelihood that customers will recommend the company to others. - Customer Satisfaction Score (CSAT)
Assesses customer satisfaction with a specific experience. - Customer Effort Score (CES)
Measures how easy it is for customers to interact with the company. - Customer Churn Rate
Indicates the percentage of customers lost in a given period. - Customer Lifetime Value (CLV)
Estimates the total value generated by a customer during the entire business relationship. - Average Resolution Time (ART)
Average time required to resolve a customer problem. - First Contact Resolution (FCR)
Percentage of problems resolved at first contact. - Shopping Cart Abandonment Rate
Percentage of shopping carts abandoned without completing the purchase. - Conversion Rate
Percentage of interactions that result in transactions. - Brand Equity
Overall perception of brand value by customers. - Share of Wallet
Percentage of a customer’s total spend dedicated to the company. - Customer Advocacy
Measure of customers actively promoting the company. - Channel Costs
Cost per interaction for each communication channel. - Self-Service Rate
Percentage of interactions resolved via self-service channels. - Emotion Scoring
Analysis of customer sentiment in interactions. - Average Handle Time (AHT)
Average time taken to handle an interaction, including follow-ups.
Let’s delve a little deeper into these metrics
1. Net Promoter Score (NPS)
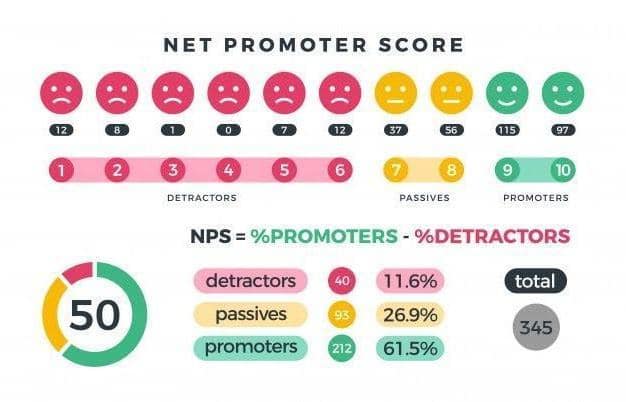
Have you ever recommended a product to a friend? If yes, then you have been a promoter, exactly as measured by the NPS. This metric gives you an idea of how many customers are so satisfied that they drive others to your company.
2. Customer Satisfaction Score (CSAT)
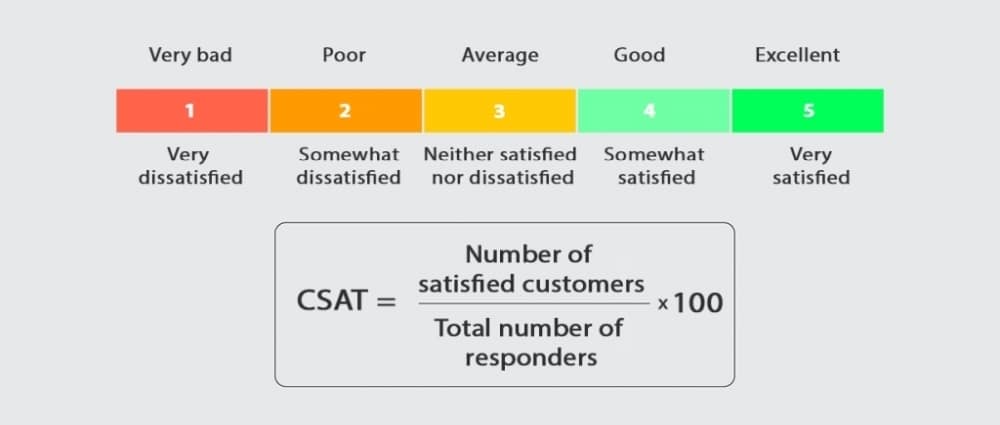
Simple yet powerful, the CSAT allows you to immediately understand how happy your customers are with their interactions with you. Think of it as a report card: it is your grade at the end of each experience.
3. Customer Effort Score (CES)
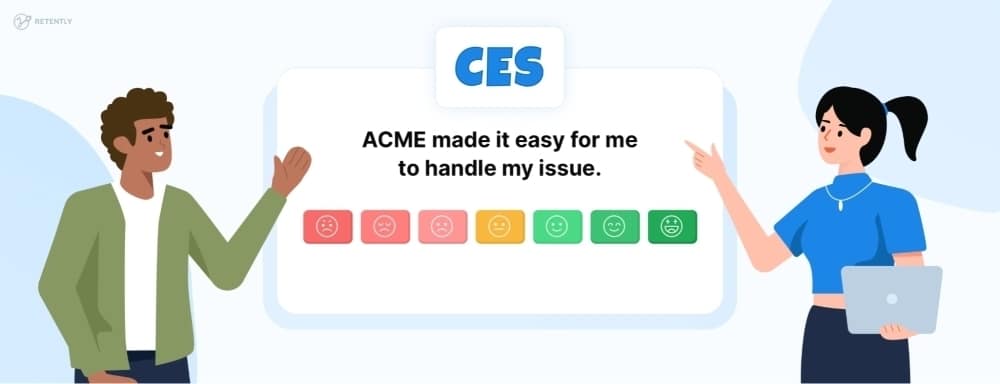
If it is too complicated to buy a product or get support, customers go elsewhere. CES tells you how good you have been at simplifying things.
4. Customer Churn Rate
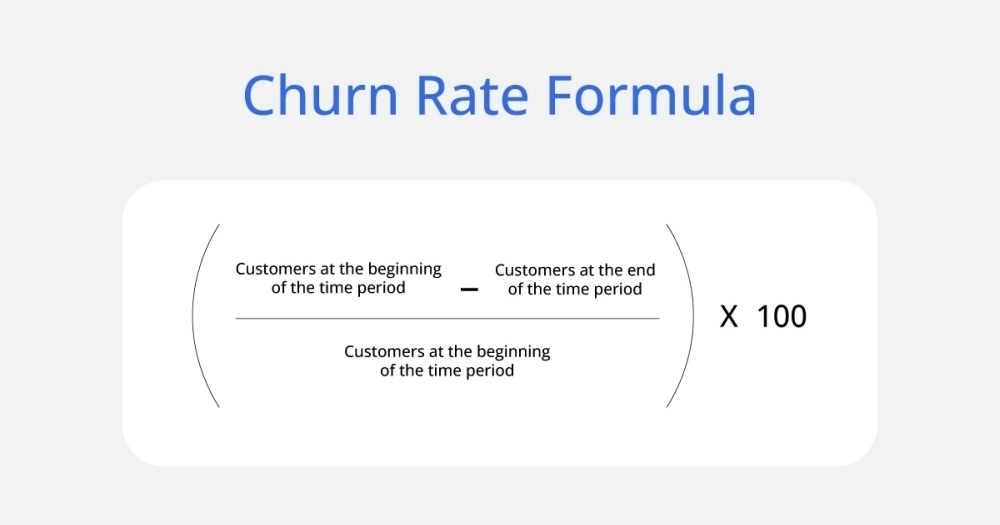
Imagine filling a bucket of water with a hole in the bottom. This hole is your churn rate. Monitoring it means knowing how much you are losing and, more importantly, how to plug the hole.
5. Customer Lifetime Value (CLV)
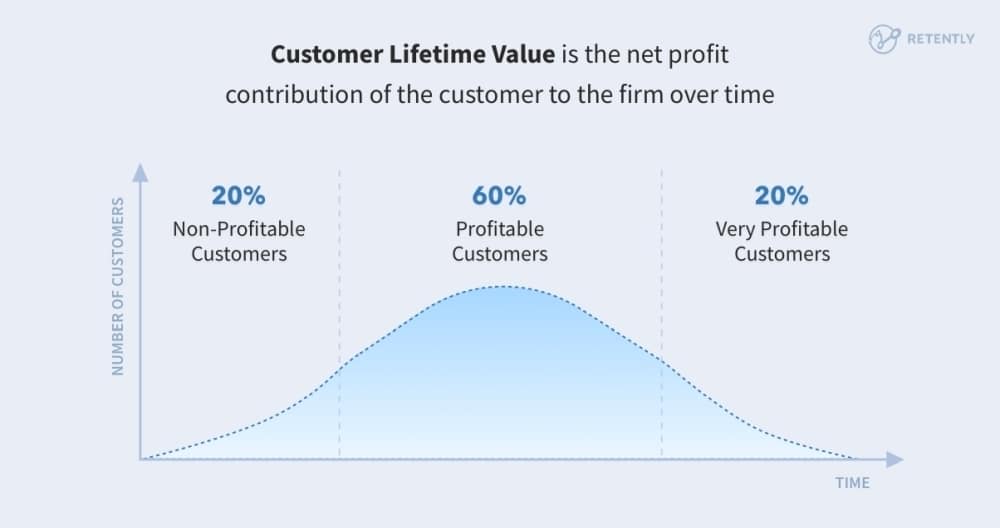
Not all customers have the same value. CLV helps you understand which customers bring the most value to your business over the long term. By analysing this metric, you can identify the most profitable relationships and focus your efforts on those who are truly crucial, optimising resources and strategies to maximise return on investment.
6. Average Resolution Time (ART)
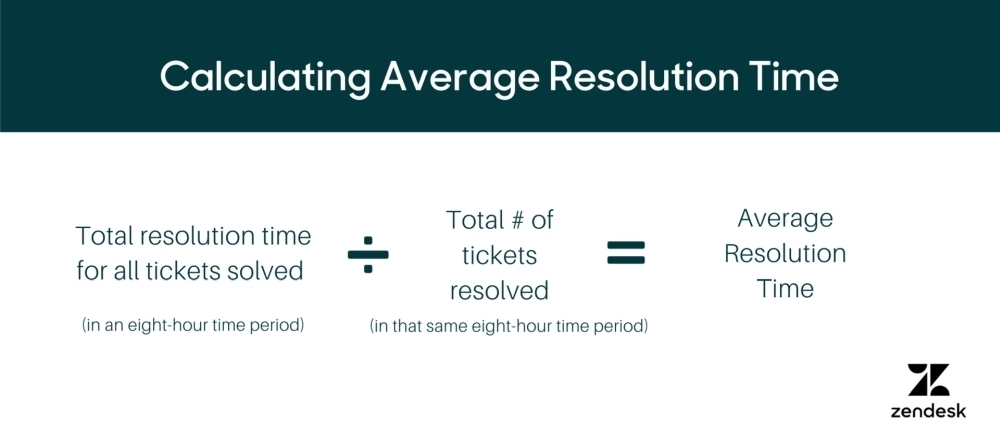
When a customer has a problem, they want it solved quickly. Low ART is synonymous with efficiency and attention.
7.First Contact Resolution (FCR)
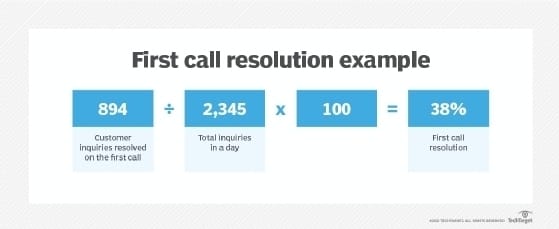
Solving a problem on the first attempt is like scoring a goal on the first play: direct, effective and satisfying.
8. Shopping Cart Abandonment Rate
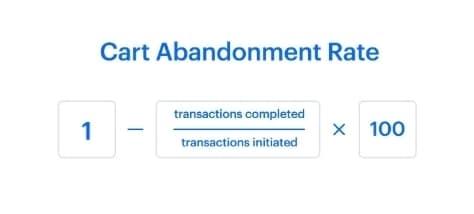
Every abandoned shopping cart is a missed opportunity. Understanding why it happens can make the difference between closing a sale or losing it.
9. Conversion Rate
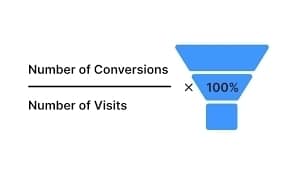
Getting noticed is important, of course, but what really counts is being chosen. The conversion rate measures just that: how many of the people you attract decide to become customers. Monitoring it helps you understand whether you are simply attracting curious people or whether your strategies are actually turning interest into action. It is the metric that separates good promises from real results.
10. Brand Equity
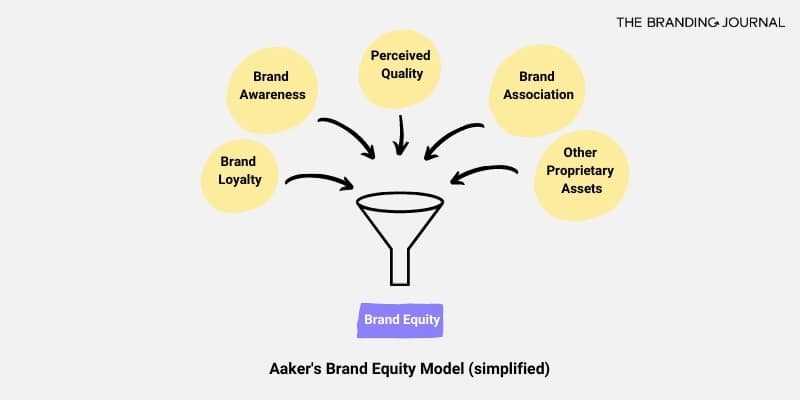
How strong is your reputation? Brand equity is how customers perceive the value of your company. Brand equity is the sum of several key factors: brand awareness, i.e. how recognisable the brand is; brand loyalty, which measures customer loyalty; perceived quality, i.e. the value customers attach to the product or service; and other elements such as brand associations and past experiences. Often, it is closely linked to perceived value and the company’s ability to effectively communicate its value. All these aspects help define how strong and valuable your brand is in the minds of customers.
11. Share of Wallet
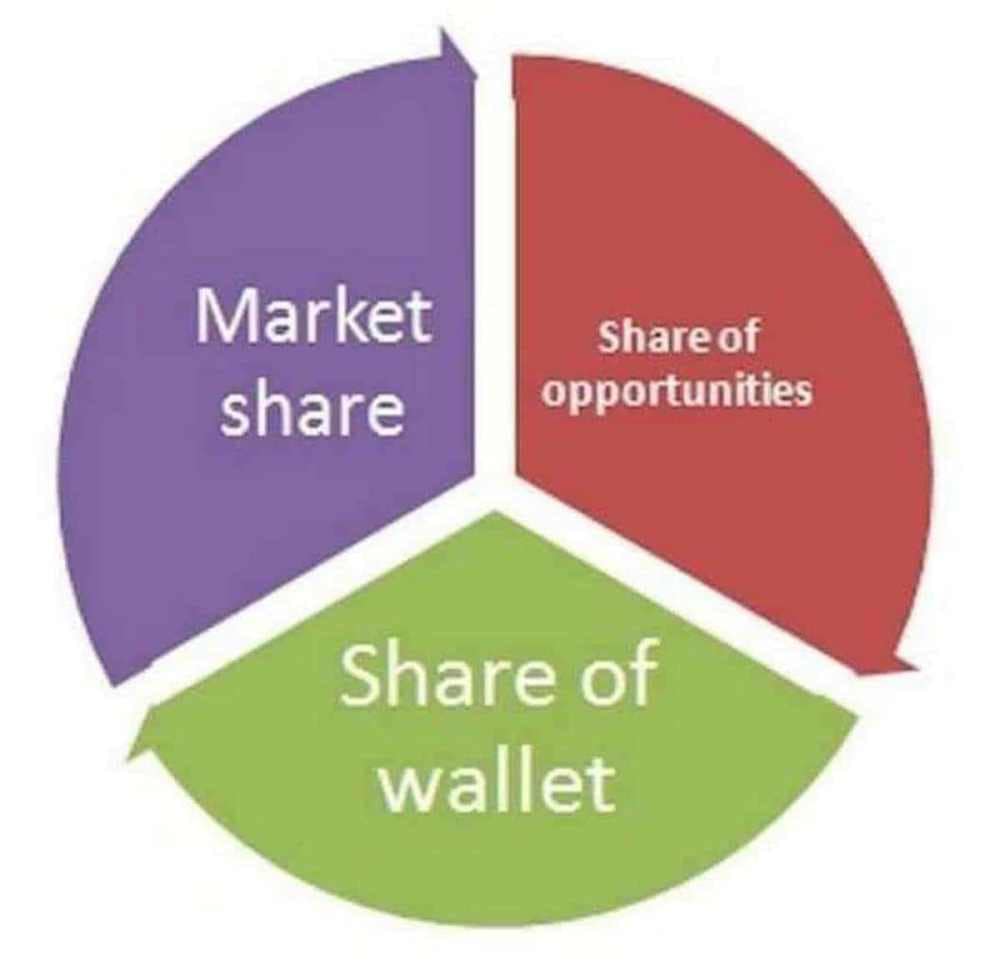
The ‘Share of Wallet’ measures the percentage of a customer’s total budget allocated to your products or services compared to those of your competitors. In other words, it represents how much you are able to make them choose you over others. Increasing this metric means building customer loyalty and encouraging them to focus their spending on you through strategies such as targeted promotions, loyalty programmes and customised offers. Understanding and improving Share of Wallet is crucial to maximising the value generated by existing customers.
12. Customer Advocacy
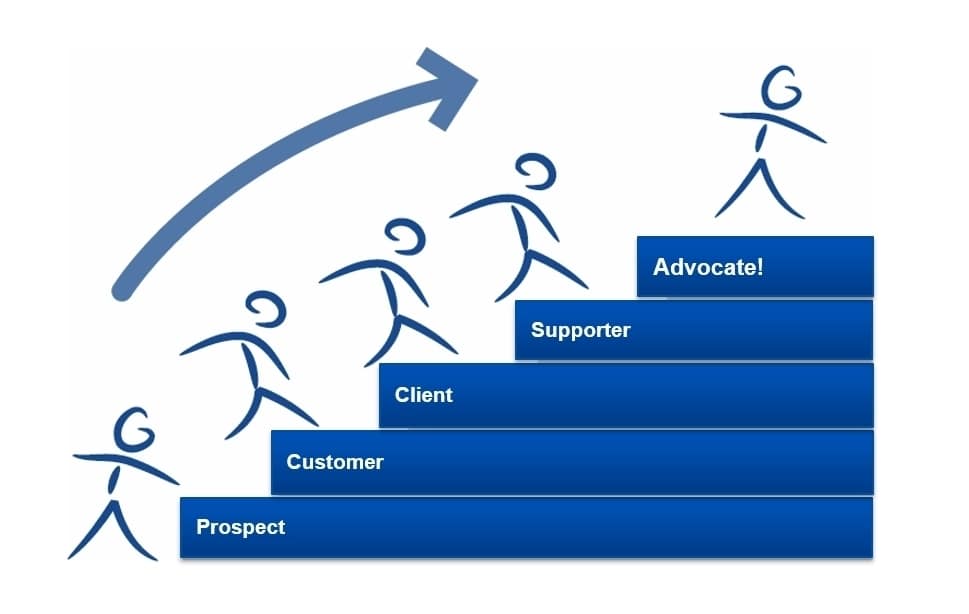
Customer advocacy is not only about whether your customers speak well of you, but how actively they are willing to promote you. This concept measures the degree of trust, loyalty and engagement that customers have with your brand, turning them into true ambassadors.
To reach this level, it is crucial to offer exceptional experiences and create an emotional bond with customers. According to Smart Tribune, strong customer advocacy is fuelled by several factors: service reliability, perceived quality, quick problem resolution and a sense of brand ownership. In addition, companies that invest in loyalty programmes, personalised experiences and transparent communication are more likely to build advocacy.
Measuring this metric is crucial to understanding the impact of positive word-of-mouth and the growth potential that existing customers can generate.
13. Channel Costs
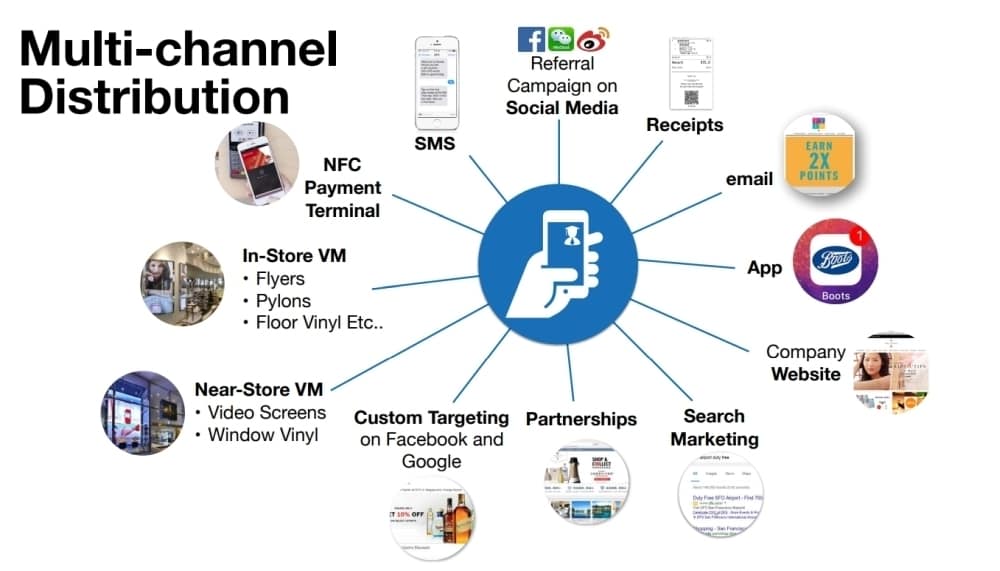
Do you know how much it costs you to interact with customers? Measuring the costs of communication channels is essential to optimise efficiency without sacrificing service quality. Understanding the cost structure of channels allows you to identify unnecessary expenses, assess the effectiveness of various channels and better allocate resources.
The benefits of this analysis are tangible: you can reduce operating costs, improve efficiency and allocate budget to the best performing channels. In practice, having this information allows you to invest where it pays off! It means avoiding wasting money, time and resources on unprofitable activities. Not having this information, on the other hand, means navigating in the dark: you may continue to invest in expensive and inefficient channels, wasting valuable resources and risking disappointing customers.
14. Self-Service Rate
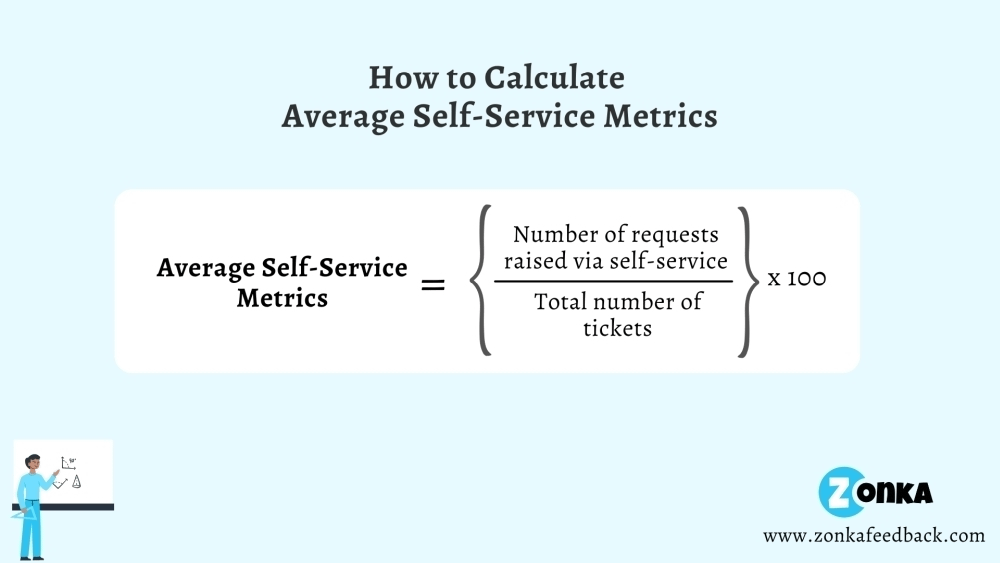
If a customer easily finds what he is looking for on his own, you are winning in efficiency. We have already discussed this in a previous article. Investing in user experience is not only a benefit for customers, but also a tangible gain for the company. If a customer is able to find the answers or products they need themselves, the burden on human support is drastically reduced. This means lowering operational costs and freeing up valuable resources that can be allocated to strategic activities such as innovation and development.
Furthermore, self-service channels, such as well-designed chatbots or FAQs, can collect valuable data on user behaviour. This information provides crucial insights to continuously improve service and personalise future experiences. Not taking advantage of these platforms means not only facing higher costs, but also missing opportunities for growth and loyalty.
15. Emotion Scoring
Understanding how your customers feel is essential for building lasting relationships. Emotion scoring is the key. Emotion scoring helps you understand what customers really feel when they interact with your company. It is not just a simple ‘like’ or ‘dislike’, but an analysis of the entire emotional spectrum: from excitement to frustration, from confidence to disappointment. This metric goes beyond traditional numbers, trying to capture the deeper feelings that influence customer decisions.
How does it work? It analyses data from surveys, feedback, online reviews and social media, often with the help of artificial intelligence algorithms. These tools decipher the language, tone and words used by customers to identify emotional signals.
And the benefits? Understanding emotions enables targeted action: solving hidden problems, improving pain points and creating personalised experiences that increase loyalty. Ignoring this information means missing valuable opportunities to differentiate from competitors and build authentic relationships. In a market where emotions often drive choices, emotion scoring is the key to making a real difference.
16. Average Handle Time (AHT)
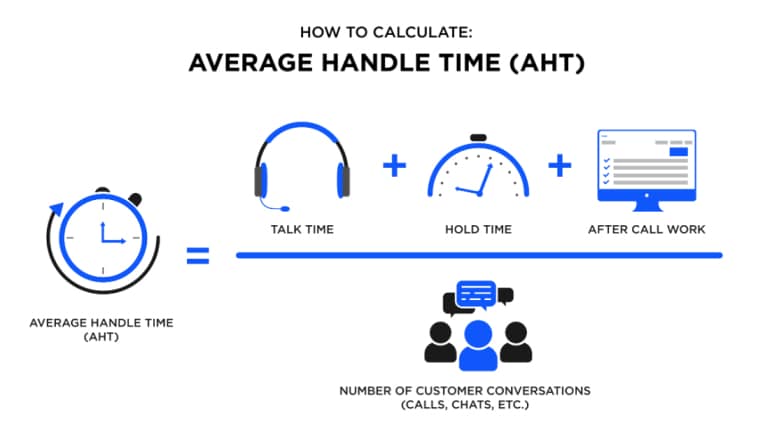
The AHT measures the average time required to handle a customer interaction, from start to finish, including follow-ups. This metric is key to finding the right balance between efficiency and service quality.
Reducing AHT without sacrificing quality means optimising resources, increasing customer satisfaction and improving team efficiency. For example, a low AHT may indicate that internal processes are smooth and that customer service representatives have the right tools to solve problems quickly. However, an AHT that is too low may suggest that interactions are too rushed and not thorough enough, leaving customers dissatisfied.
Ignoring this metric can lead to operational inefficiencies, increased costs and frustrated customers. Monitoring and analysing AHT allows you to identify bottlenecks, improve procedures and ensure a positive and consistent customer experience.
Less time, more efficiency: but only if done with quality. AHT helps you find the right balance.
Conclusion
Measuring the customer experience is not just a matter of numbers, but a strategy for building stronger and more profitable relationships with customers. The metrics we have explored are valuable tools for better understanding customer needs, identifying weak points and optimising each stage of the customer journey. Focusing on these areas enables companies to reduce costs, increase revenues and improve customer loyalty.
As the cited sources show, investing in the customer experience is a choice that pays off in the long run. Whether it is improving operational efficiency, increasing satisfaction or turning customers into brand ambassadors, CX metrics offer an essential competitive advantage in an increasingly customer-centric world.
Now it’s your turn: which metrics will you start monitoring to take your company to the next level? The future of your business may depend on the answers you give.